
Seismic reflection profiling is an echo sounding technique. A controlled sound pulse is issued into the Earth and the recording system listens a fixed time for energy reflected back from interfaces within the Earth. The interface is often a geological boundary, for example the change of sandstone to limestone. Once the travel-time to the reflectors and the velocity of propagation is known, the geometry of the reflecting interfaces can be reconstructed and interpreted in terms of geological structure in depth. The principal purpose of seismic surveying is to help understand geological structure and stratigraphy at depth and in the oil industry is ultimately used to reduce the risk of drilling dry wells. The method is certainly not exact - many subjective decisions are made during the course of acquisition, processing and interpretation of a seismic survey. Experience and judgement are critical to success and often an iterative approach is taken to improve the results over time as new information becomes available e.g. new well locations.
The following figure shows a simple earth model and resulting seismic section used to illustrate the basic concepts of the method.
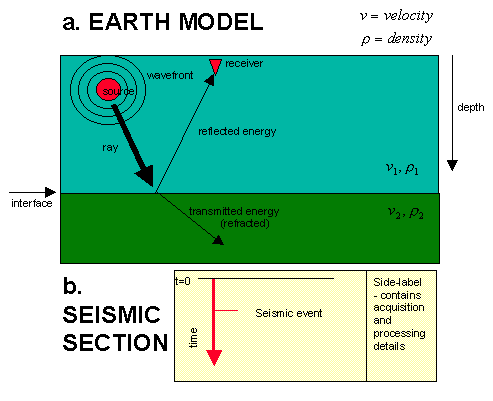
The terms source, receiver and reflecting interface are introduced. Sound energy travels through different media (rocks) at different velocities and is reflected at interfaces where the media velocity and/or density changes. The amplitude and polarity of the reflection is proportional to the acoustic impedance (product of velocity and density) change across an interface. The arrival of energy at the receiver is termed a seismic event. A seismic trace records the events and is conventionally plotted below the receiver with the time (or depth axis) pointing down the page. Click here to see a movie illustrating wave propagation. The colour background is the velocity field.
Only the two-way seismic travel time is measured, whereas the reflector structure is in depth. Depth is the product of the one-way travel time and velocity, so seismic velocity is required to determine the depth structure of the interface. As the velocity is largely unknown, this represents a major ambiguity in the method. Velocity interpretation is the key to solving many complex subsurface problems.
For small deformations rocks are elastic, that is they return to their original shape once a small stress applied to deform them is removed. Seismic waves are elastic waves and are the "disturbances" which propagate through the rocks. The most commonly used form of seismic wave is the P(primary)-wave which travels as a series of compressions and rarefractions through the earth the particle motion being in the direction of wave travel. The propagation of P-waves can be represented as a series of wavefronts (lines of equal phase) which describe circles for a point source in a homogeneous media (similar to when a stone is dropped vertically onto a calm water surface). As the wavefront expands the energy is spread over a wider area and the amplitude decays with distance from the source. This decay is called spherical or geometric divergence and is usually compensated for in seismic processing. Rays are normal to the wavefronts and diagrammatically indicate the direction of wave propagation. Usually the shortest ray-path is the direction of interest and is chosen for clarity. Secondary or S-waves travel at up to 70% of the velocity of P-waves and do not travel through fluids. The particle motion for an S-wave is perpendicular to it's direction of propagation (shear stresses are introduced) and the motion is usually resolved into a horizontal component (SH waves) and a vertical component (SV waves). Further types of surface seismic waves (e.g. Rayleigh, Love waves) exist but are not important for seismic exploration except sometimes as sources of noise.
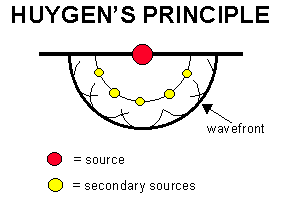
Huygen's principal is illustrated in the adjacent figure. The principal states that each point on a wavefront acts as a new secondary source to form the next wavefront. The figure shows just five secondary sources. More would interfere constructively to form the wavefront shown in bold.
The following table illustrates reflection strengths for various typical interfaces encountered assuming normal incidence (the ray intersects the interface at right angles). This is a good approximation if the source to receiver distance is much smaller than the depth of the interface. The acoustic impedance for each interface (Z1 and Z2) is calculated by multiplying velocity and density. The reflection strength is defined by the reflection coefficient which is computed from R=(Z2-Z1)/(Z2+Z1). The table has been adapted from Sheriff and Geldart, Exploration Seismology Volume 1. Velocities are given in km/s and density values in g/cm3. A negative reflection coefficient indicates a 180o phase reversal upon reflection.
|
Interface |
V1 |
D1 |
V2 |
D2 |
Z1/Z2 |
R |
Comments |
|
Sandstone on Limestone |
2.0 |
2.4 |
3.0 |
2.4 |
0.67 |
0.2 |
Hard interface. |
|
Limestone on Sandstone |
3.0 |
2.4 |
2.0 |
2.4 |
1.5 |
-0.2 |
|
|
Shallow Interface |
2.1 |
2.4 |
2.3 |
2.4 |
0.93 |
0.045 |
Typical reflection. |
|
Deeper Interface |
4.3 |
2.4 |
4.5 |
2.4 |
0.97 |
0.022 |
|
|
Soft water bottom |
1.5 |
1.0 |
1.5 |
2.0 |
0.5 |
0.33 |
|
|
Hard water bottom |
1.5 |
1.0 |
3.0 |
2.5 |
0.2 |
0.67 |
Hardest interface. |
|
Water surface |
1.5 |
1.0 |
0.36 |
0.0012 |
3800 |
-0.9994 |
Almost perfect reflection. |
|
Shale over water sand |
2.4 |
2.3 |
2.5 |
2.3 |
0.96 |
0.02 |
|
|
Shale over gas sand |
2.4 |
2.3 |
2.2 |
1.8 |
1.39 |
-0.16 |
Polarity reversal. |
|
Gas sand over water sand |
2.2 |
1.8 |
2.5 |
2.3 |
0.69 |
0.18 |
|
In marine data acquisition the water-seabed interface is usually the strongest in the section and a large portion of the seismic energy can be trapped in the water layer bouncing back and forward. These multiple reflections strongly affect the quality of marine seismic data, particularly that acquired in higher latitudes where the seabed tends to be harder.

At each interface the amount of energy reflected is proportional to the acoustic impedance contrast at the interface. The energy of the original pulse therefore decays by divergence and also with each reflection as each input pulse is continuously reflected by changes in impedance as it passes through the earth. The pulse also will change shape as it travels through the earth due to the mechanisms of absorption, scattering and dispersion because the higher frequencies are attenuated more rapidly. For example a typical modern seismic source will input frequencies between 5-100Hz but a typical reflection from a Jurassic target may be dominated by 30Hz signal. Several processing routines will be used to attempt to compensate for attenuation of the wavefield as it passes through the Earth. The previous figure compares a typical input sleeve airgun source array pulse (a) and that recorded from a target reflection (b). Amplitudes have been normalised for display purposes. High frequencies have been lost through the various processes of attenuation. Further discussion on the time and frequency domain is included later in the text.
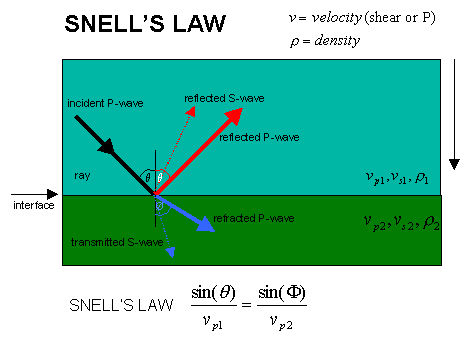
The adjacent figure illustrates what happens when a P-wave is incident at an angle upon an impedance contrast. Part of the energy is reflected back towards the surface (this is the most interesting part), part of the energy is refracted and transmitted through the interface (also useful), and some of the energy is mode converted into S-waves. Snell's law states that the angle of incidence (q) is equal to the angle of reflection and that the angle of refraction (f ) is determined by the velocity contrast at the interface and can be calculated from the formula shown. The Zoeppritz equations give the amplitudes of the phases for a given angle of incident wave when the velocity and densities either side of the interface are known. Such information is used in amplitude-versus-offset analysis.
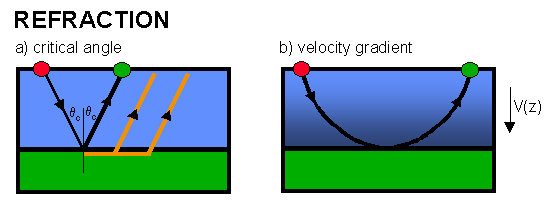
At most interfaces the majority of energy is transmitted through the interface. At a particular angle of incidence (qc) called the critical angle, f =90o there is no transmission and all the energy is either reflected or travels along the boundary between the layers as a head wave (shown in orange on the previous figure). The headwave travels much of its time in the faster deeper layer and may arrive at the receivers before the direct arrival (energy travelling directly between source and receiver). Figure (b) shows wave propagation in a velocity gradient where continuous refraction results in a curved ray-path. Usually this latter situation is represented by a series of constant velocity layers.
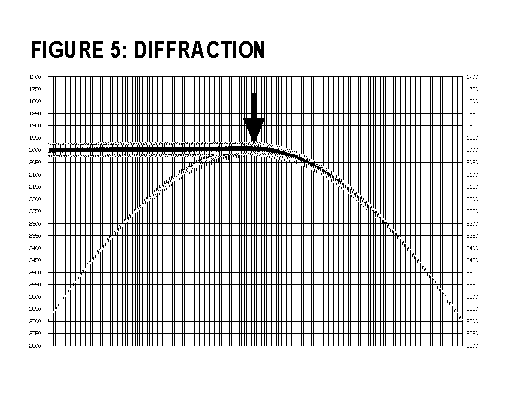
The adjacent figure illustrates what happens when a seismic wave encounters an abrupt interface such as a termination due to faulting. For constant velocity a hyperbolic event called a diffraction is generated. The process of migration is used to collapse diffractions and also to place dipping seismic events in their correct sub-surface position. A reflector or indeed an entire seismic section can be thought of as constructed of many diffracting points which constructively and destructively interfere to produce the image (as in Huygen's principal).
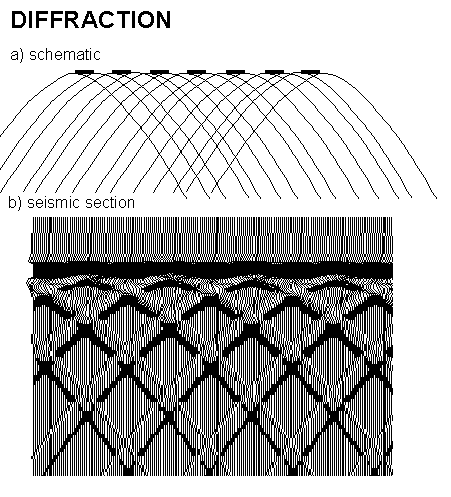
This concept is illustrated both schematically and with a synthetic seismic section in the adjacent figure.
The seismic traces can be displayed in a variety of ways, but the commonest paper display is to place the traces side by side and to shade in the positive part of the trace. This is called a variable area and wiggle display. Click here for more details on seismic display.