
The commonest form of filtering is to remove unwanted frequency components from the data by bandpass frequency filtering. This may be to remove frequencies above the Nyquist before re-sampling or to remove noise types e.g. low frequency swell noise from the data. Most commonly bandpass filters are applied post-migration to improve the clarity of the display. While filters can be applied in several domains they are usually designed in the frequency domain for clarity. They may be applied in the time domain by convolution or in the frequency domain by multiplication, however this is usually transparent to the user. The user has to decide whether to apply a minimum phase or zero-phase filter and must input sufficient parameters to specify the pass or reject bandwidth.
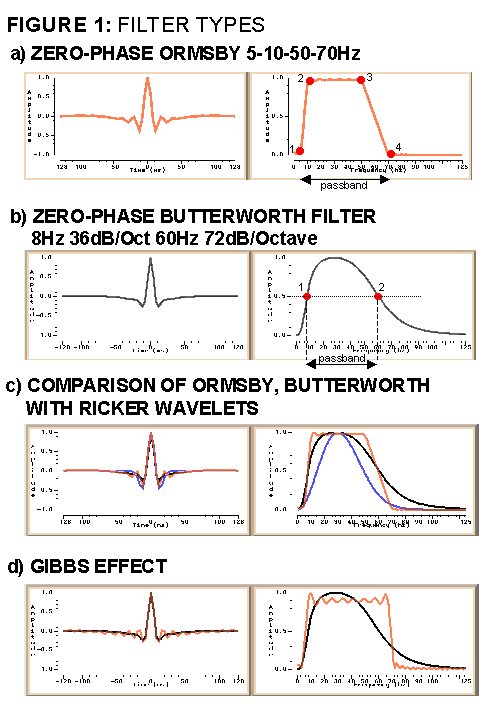
Filters are usually zero-phase (Ormsby) or minimum phase (Butterworth) although the filter type can actually be of either phase and this should be clearly stated. The passband of a zero-phase Ormsby filter is usually defined by up to four corner frequencies as shown by Figure 1a. The passband of a Butterworth filter is more complex and involves two cutoff frequencies (Figure 1b) where the filter is at half power (or 3dB down on maximim power). Two filter slopes are also required and are specified in terms of decibels per octave. An octave is defined as a doubling of frequency e.g. 120Hz is an octave above 60Hz. The decibel is a unit of scale defined in acoustics as 20.log(A/B) where A and B are the quantities (usually amplitudes) in question. If A is twice the amplitude of B this translates to 6dB, a factor of 10 to 20dB and a factor of 100 translates to 40dB. The passband of the butterworth filter is defined at the corner point where the amplitude spectrum is 3dB down (approximately half) on the maximum (within the passband). This somewhat confusing terminology comes from electrical engineering.
Figure 1b shows a typical zero-phase Butterworth filter. The slopes are usually gentler than the Ormsby filter a typical lower slope being 18dB/Octave and upper slope 72dB/Octave. Figure 1c compares the filters in Figure 1a and 1b with a zero-phase 30Hz Ricker wavelet (shown in blue). The Ricker is often used for synthetic modelling since it has an attractive time domain response, however, note the differing frequency responses of the three filters.
If the filter slopes are too steep as shown in Figure 1d, then undesirable ringing will occur in the time domain (Gibbs effect). This effect is especially easy to create with Ormsby filters by specifying unrealistic steep slopes such as 5-6-50-51Hz. Some packages tend to reduce this effect by tapering filter slopes. Software packages GX2, LogM and Geoquest provide interactive modules which can be used to study filters and wavelets.
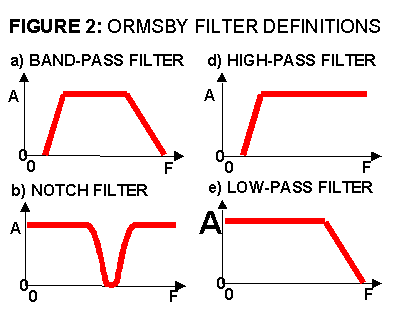
Figure 2 shows the amplitude spectrum of several different types of filter and introduces several terms and filter parameters. The bandpass filter is by far the commonest filter used. A notch filter might be used to suppress a single frequency for example that of power lines adjacent to a land survey. A high pass filter is often used prestack to suppress acquisition noise. A low-pass filter is rarely used. Similar diagrams can be constructed for Butterworth filters.
Frequency filtering is commonly applied prestack prior to temporal resampling to prevent aliasing (these anti-alias filters are defaulted in many processing systems) and to suppress noise. A common form of low frequency noise is generated by movement of the kerosene within cable sections of the streamer. Resonance occurs at around 4Hz and can be picked up by the hydrophones to create a nasty looking shot record. A minimum phase Butterworth high pass filter of 5Hz 18dB/Octave is usually adequate to suppress this noise. It would be usual to test 4, 5 & 6 Hz filters with 18dB/Octave slopes to suppress the noise and to choose the lowest possible to retain maximum bandwidth in the shot records. Other acquisition noise such as swell noise and propeller noise may also be suppressed by bandpass filtering if they are of sufficient amplitude to be detrimental to the section. Note that a standard FK filter also has a built in low frequency filtering action which may mimic that of the high-pass filter. An FK filter may however be detrimental to the primary wavefield (for instance an 8Hz cut is common) and the contractor should state clearly what filter is being applied.
It is also common to run a set of filter trials on gain corrected shot records to determine the approximate bandwidth of the data prior to any further processing. Such trials can be used to estimate approximate filter boundaries for intermediate display purposes.
Prestack filters should normally be minimum phase since the source is assumed to be minimum phase and as previously demonstrated the convolution of two minimum phase wavelets is minimum phase whereas the convolution of a minimum and zero-phase wavelet is mixed phase. Some contractors have used zero-phase anti-alias filters prior to re-sampling which is therefore incorrect.
Once the data have been migrated they are usually bandpass filtered to improve the clarity of the display by increasing the signal-to-noise ratio. This is required since the higher frequencies are usually lost in the deeper sections due to various attenuation mechanisms and without filtering the clarity of the deeper section is reduced by the presence of high-frequency noise. It is normal to pass higher frequencies in the shallow part of the section and filter high frequencies in the deeper part.
If the migrated data have been converted to zero-phase then zero-phase filters may be used, otherwise minimum phase filters should be used.
PRE-MIGRATION FILTERING
If the stack is exceptionally noisy then a filter may be required prior to migration. Such a filter should be as open as possible to avoid attenuating primary energy within the section (e.g. passing 5-70Hz) and generally should be avoided since the energy moves from deeper to shallower parts of the section during migration. A time-variant filter should not be used prior to migration unless absolutely required since the effects of this can be unpredictable on the migration results.
TIME VARIANT FILTER
If a time variant filter is chosen then the start of the application windows and length of window overlap (where the filters merge) will also have to be selected. Merge zones should be chosen to avoid principal areas of interest - note that this may also vary across the survey area. When choosing time-variant filters it is essential to remember any strong lateral changes in geology in the survey area. It is possible to make the filter windows follow geological horizons (common for a dipping seabed, but otherwise rare), but this is not recommended unless absolutely required since it may confuse the interpreter. It is also sensible to note that if the data is required to tie other vintages then it is wise to check the filters applied to these vintages since a filter mis-match could result in change of character of a target event which could conceivably lead to mis-interpretation.
FILTER TRIALS
The appropriate post-migration filter should be selected by filter trials. An entire section, or more usually a portion of section of 500 traces deemed representative, would be taken and run through a series of filter trials. The trials should be displayed, ideally side by side, at fixed gain level. If an AGC is applied following the trials then an ungained version should also be displayed for reference (this is often more useful). The following figures show examples of a frequency filter trial. The processor and interpreter would use their skill and judgement to pick the optimum time variant filter for the data. The contractor can normally be trusted to run suitably diagnostic filter trials.
There are four types of filter trial commonly in use. The commonest is to display a series of filters with passbands and slopes similar to that to be used in the final section. This type of test, commonly produced by a contractor with AGC, gives a view of the data as it will look if the filter is actually chosen for the final data. However, the test is poor for determining the bandwidth of the section or identifying any particular noise types. The following displays test zero-phase Ormsby filters using PROMAX displays at fixed gain. The target region is between 1000-1600ms but resolution in the upper section and deeper sections are also important.
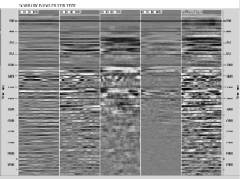
1. The narrow band filter test is perhaps the most useful and is good for determining the bandwidth of the section, identifying various noise types and picking both high and low cuts for time-variant filters. Click here for an enlarged display. The test compares the following filters (left to right) 0-10-20-30Hz, 20-30-40-50Hz, 40-50-60-70Hz, 60-70-80-90Hz and the furthest panel to the right is unfiltered and unscaled. It would be commoner to use 5Hz bands. Panel 4 shows that there is little of the 80-90Hz component, especially below 1600ms.
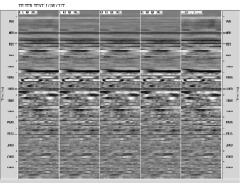
2. The adjacent figure shows a low cut filter test useful for detecting and suppressing low frequency noise. Click here for an enlarged display. The test compares the following filters (left to right) 0-5-60-70Hz, 5-10-60-70Hz, 10-15-60-70Hz, 15-20-60-70Hz and the furthest panel to the right is unfiltered and unscaled. Panel 2 shows that the 5-10Hz low cut is sufficient to attenuate the low frequency noise in the upper 400ms of the section. Panel 4 shows that by removing the 0-15Hz frequency component the section below 1400ms is degraded.
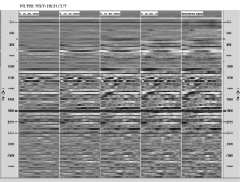
3. The adjacent figure shows a high cut filter test useful for detecting high frequency noise. Click here for an enlarged display. The test compares the following filters (left to right) 0-10-30-40Hz, 0-10-40-50Hz, 0-10-50-60Hz, 0-10-60-70Hz and the furthest panel to the right is unfiltered and unscaled. Panels 1 & 2 show undesirable attenuation of high frequencies in the target region reducing available resolution. Panel 2 probably provides the best frequency response from the deeper section below 1600ms.